
NETWEB - Is this the end of the rally?

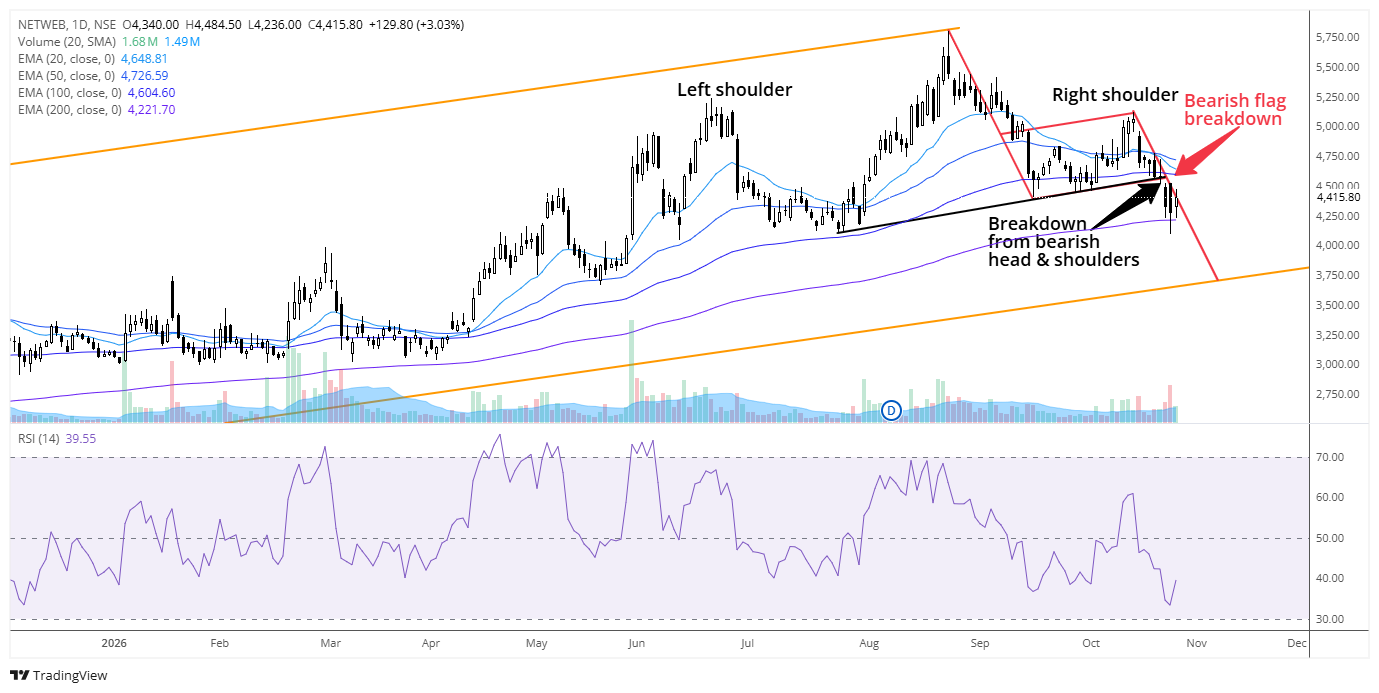
NETWEB has started to move down in a lower high and lower low structure and signals the start of a downtrend. The stock has started to sustain below the 20-day, 50-day, and 100-day EMAs, which is a negative sign for medium-term bulls. Also, the stock is close to breaking the 200-day EMA as well, which, if it happens, would turn the long-term trend bearish. The stock has exhibited multiple bearish patterns - corrective ABC structure and a bearish head and shoulders pattern. The breakdown of both these patterns happened with a rise in volumes. A fresh resistance has formed around 4500 to 4540 levels, and a bounce towards it is an exit opportunity for short/medium term traders.
Clearly, the stock is now in a downtrend, and any bounce is an exit opportunity. A corrective ABC pattern could drag prices lower towards 3750, while a bearish head & shoulders could drag it lower towards 3000 in the next few months.
ADITYA THUKRAL, PROPRIETOR, AT RESEARCH AND RISK MANAGERS
SEBI Registered Research Analyst INH000013794
Refer to the disclaimer: