
CREDITACCESS GRAMEEN LTD. — Technical Stock Report

📊 CREDITACCESS GRAMEEN LTD. — Technical Stock Report
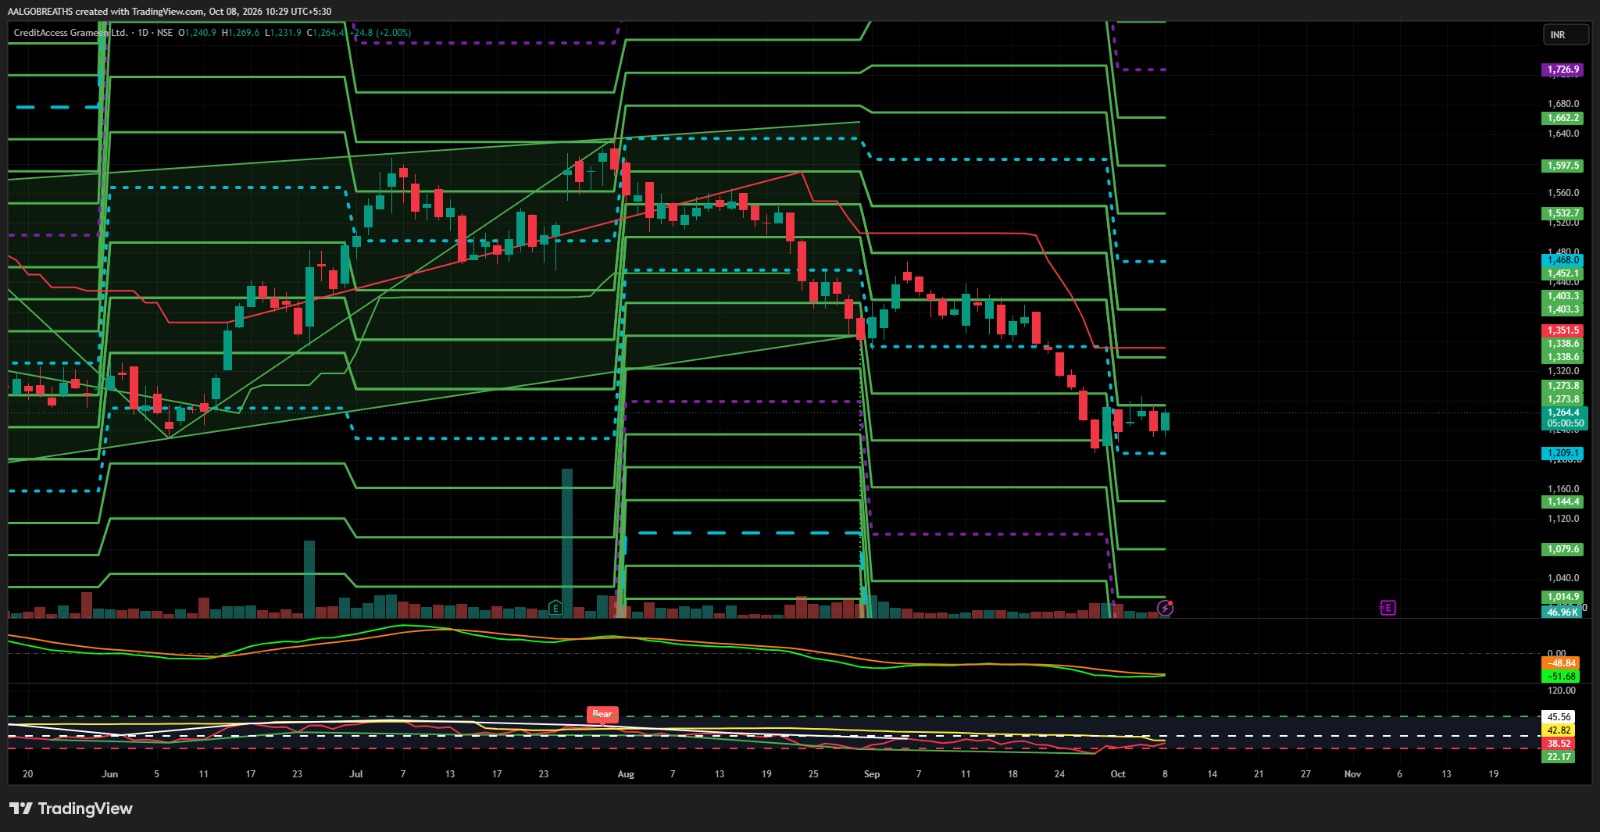
CreditAccess Grameen is currently showing a weak/bearish structure on the daily chart. The stock has declined from the ₹1,500+ zone and is now consolidating near ₹1,260–₹1,275 after testing the ₹1,209 support area.
Technical View: Price remains below key resistance levels, while momentum indicators are weak. Immediate resistance is around ₹1,275–₹1,338. A sustained move above ₹1,338 can improve the structure, while failure to hold ₹1,209 may increase downside pressure.
Key Levels:
🔹 Support: ₹1,209 / ₹1,144
🔹 Resistance: ₹1,275–₹1,338
🔹 Major Resistance: ₹1,403–₹1,452
🔹 Upside Levels: ₹1,468 / ₹1,532
Bullish Scenario: Sustaining above ₹1,338 may trigger a recovery towards ₹1,403–₹1,452.
Risk: Breakdown below ₹1,209 can weaken the setup further and may lead towards ₹1,144.
Trading View: Cautious/negative until the stock reclaims the ₹1,338 zone with strength.
For educational purposes only. Not a buy/sell recommendation.
— AALGO BREATHS 📊