
The Nifty Keeps Dying at the Same Price. 24,150 Is the Wall That Decides Everything This Week.

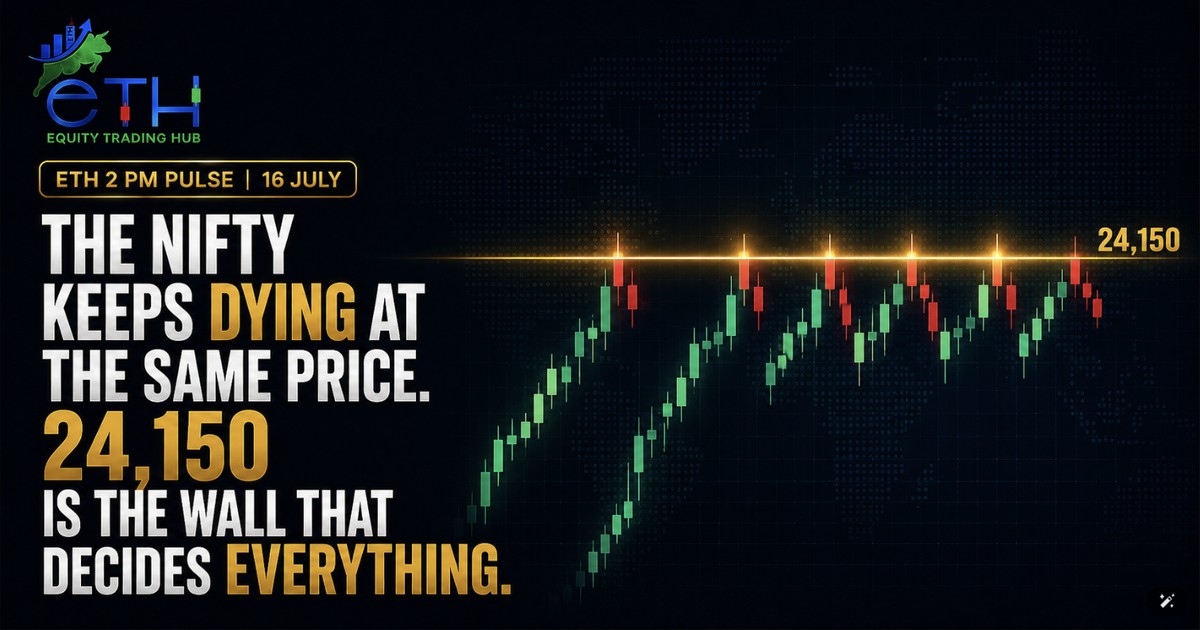
Pull up a 15 minute chart of the Nifty and look at the last two sessions. Yesterday the index rallied hard in the morning and gave it all back. Today it opened 80 points up at 24,160, tracking Wall Street, touched the same zone, and was sold again to a flat close near 24,073. Same price, same rejection, twice.
When a market dies at the same level repeatedly, someone large is selling there. Charts do not tell you who. They tell you where, and where is enough.
THE WALL AND WHY IT EXISTS
The 24,150 to 24,200 band is where this market has run out of buyers for two straight sessions. The reasons stack up neatly. It sits just under the psychological 24,200 round number. It is where the pre-results nerves live, with HDFC Bank reporting Saturday and the market unwilling to pay up before the biggest earnings print of the season. And it is where short-term traders who bought the early-July move have profits to protect. Sellers with inventory beat buyers with hope at this price, for now.
WHAT CONFIRMS A REAL BREAKOUT
Three conditions, all of them, not one. First, a close above 24,200, not an intraday poke. Wicks above a wall are advertising, closes are commitment. Second, Bank Nifty participating, because an index breakout without its heaviest sector is a trap with good marketing. Third, volume expanding on the breakout candle with delivery volumes confirming in the leaders. If those three line up, the path opens and the crowd that sold 24,150 becomes the crowd chasing 24,400.
IF THE WALL WINS
Support sits in layers. First the 24,000 round number, which has held every dip this week. Below that, the 23,900 to 23,850 zone where the July consolidation built its base. A close under 23,850 would be the first genuinely bearish signal on this chart in weeks, and would turn the range trade into a distribution question. Until then, weakness into 24,000 is just the range breathing.
THE HONEST READ
This is a coiled market, not a directionless one. A two-day fight at one price with results season landing this weekend is the chart's way of saying the decision has a date. Saturday's HDFC Bank numbers, which we previewed in detail on this profile, will likely pick the direction, and Monday's open will confirm it. Trade the level, not the prediction. Set your alerts at 24,200 above and 23,850 below and let the market do the choosing.
One request: do not carry oversized overnight positions into a binary event because a chart pattern looks confident. Patterns break. Position sizes do not forgive.
This analysis is part of our daily coverage. The ETH 2 PM Pulse tracks this tape live every trading day on this profile.
You own the stocks. We write the reasons. Every single time.
DISCLAIMER: This article is for education and information only. It is not investment advice, not a recommendation, and not a solicitation to buy or sell any security. Levels discussed are observations from publicly available price data as of 16 July 2026 and are not trading calls. Prateek Goel is a SEBI Registered Research Analyst (INH000025902). Investments in the securities market are subject to market risks. Read all related documents carefully before investing. Registration granted by SEBI and certification from NISM in no way guarantee the performance of the intermediary or provide any assurance of returns to investors.