
📊 NIFTY 15-MINUTE CHART: RISING TRENDLINE HOLDS KEY TO THE NEXT MOVE! 🚨📈

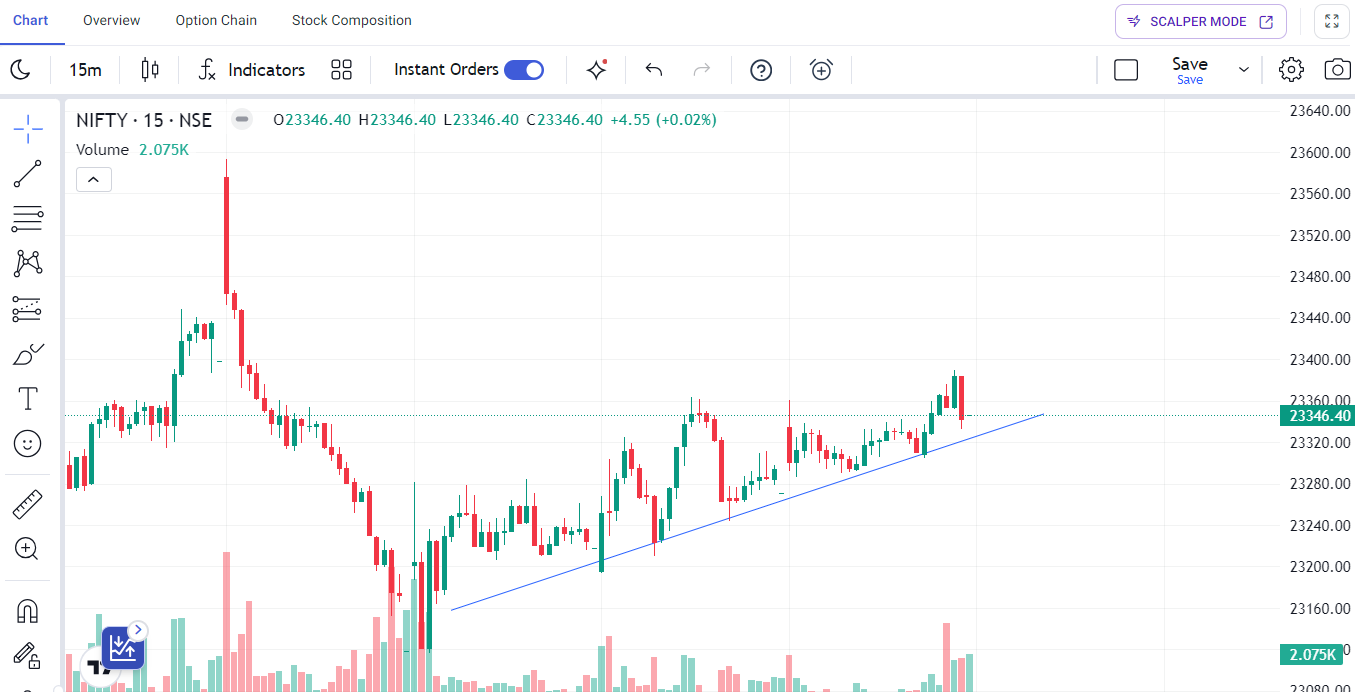
Nifty 50 closed at 23,346.40 on Friday, and the 15-minute chart in focus shows an interesting short-term setup. The index has been forming higher lows along a rising trendline, indicating that buying support has emerged at progressively higher levels. However, the latest candles show rejection from the 23,380–23,400 zone, keeping the index below an important short-term resistance area.
🔍 WHAT THE CHART SHOWS
🔹 Current/Closing Level: 23,346
🔹 Immediate Support: 23,320–23,300
🔹 Trendline Support: Around 23,300–23,320
🔹 Immediate Resistance: 23,380–23,400
🔹 Next Resistance: 23,440–23,500
🔹 Major Support Zone: 23,200–23,100
The rising blue trendline visible on the chart is currently the key short-term reference. As long as Nifty respects this trendline and remains above the 23,300 area, the recovery structure remains intact on this 15-minute timeframe.
A sustained move above 23,400 could bring the recent swing-high zone around 23,440–23,500 into focus. On the other hand, a decisive break below the rising trendline and 23,300 could weaken the setup and bring lower support levels into consideration.
Friday's broader market context was still cautious: Nifty gained 0.33% to 23,346.40, but the index recorded its sixth consecutive weekly decline, while crude oil above $100 and global rate concerns remained important risks.
Technical commentary published after Friday's close also identified 23,500–23,600 as an important resistance zone, with 23,100–23,000 as a broader support area.
📌 StockYard Technical View:
The chart currently reflects a short-term recovery within a broader cautious market structure. The key levels to watch are 23,300 on the downside and 23,400–23,500 on the upside. A breakout or breakdown with strong volume would provide better confirmation than simply trading inside the current range.
⚠️ This is a technical-market analysis based on the chart shown and current market data, not a guaranteed market prediction or investment recommendation.