
Technical Analysis — 27 Sep 2026

Bluestone Jewellery and Lifestyle Ltd. — Educational Technical Analysis
Timeframe: Weekly (1W) | Exchange: NSE
Chart reference price: ₹809.30
Purpose: Educational and informational only.
1. Trend Structure
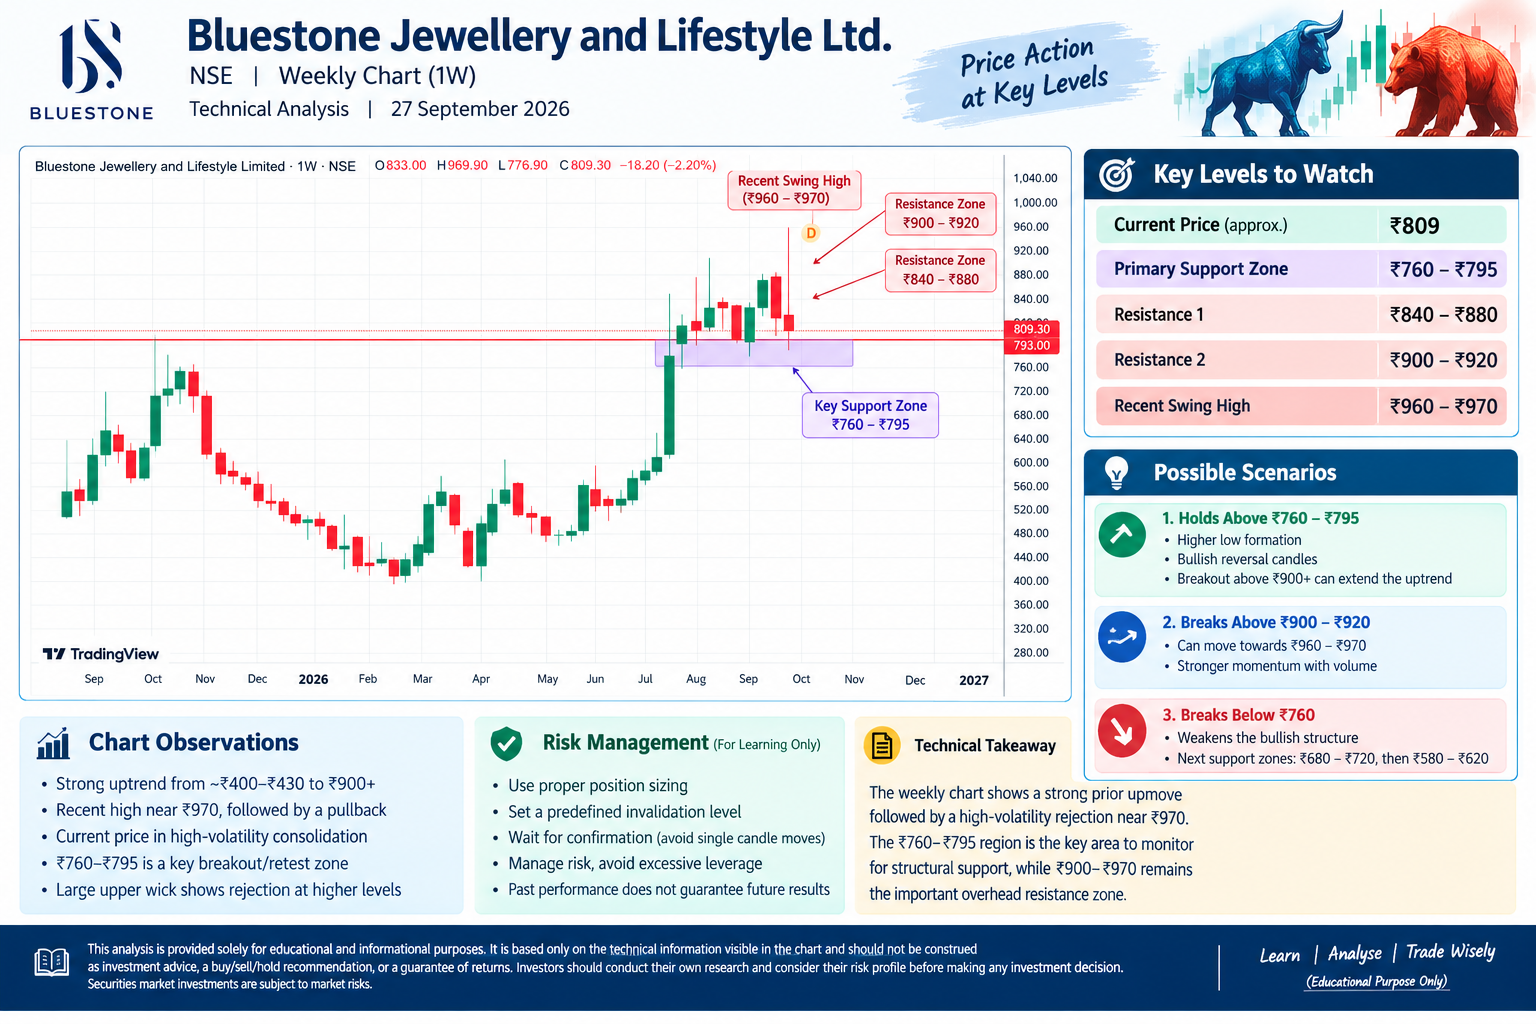
The weekly chart shows a strong recovery from the ₹400–₹430 area toward the ₹900+ zone. The recent rally has been followed by a pullback, indicating increased volatility near higher levels.
2. Support Zone
₹760–₹795 is the key support area visible on the chart.
This zone can be observed for:
- Price stability
- Formation of higher lows
- Bullish reversal candles
- Confirmation of support on subsequent weekly candles
A sustained weekly close below this zone could indicate weakening of the recent bullish structure.
3. Resistance Zones
Important resistance areas visible on the chart are:
- ₹840–₹880: Immediate resistance zone
- ₹900–₹920: Higher resistance zone
- ₹960–₹970: Recent swing-high area
The ₹960–₹970 region saw rejection, as reflected by the large upper wick on the recent weekly candle.
4. Candlestick Observation
The latest weekly candle shows:
Open: ₹833
High: ₹969.90
Low: ₹776.90
Close: ₹809.30
The long upper wick indicates that buyers pushed prices higher during the week, but selling pressure emerged at elevated levels.
A single candle should not be considered confirmation of a trend reversal. Subsequent weekly price action is important.
5. Educational Price Scenarios
If price sustains above ₹795:
The support structure remains relevant, and traders studying price action can monitor whether higher lows develop.
If price moves above ₹900–₹920:
The ₹960–₹970 swing-high region becomes an important chart reference.
If price sustains below ₹760:
The recent bullish structure could weaken, and lower historical support areas may come into consideration.
6. Technical Summary
- Primary support: ₹760–₹795
- Immediate resistance: ₹840–₹880
- Higher resistance: ₹900–₹920
- Recent swing high: ₹960–₹970
- Current observation: Pullback/consolidation after a strong upward move
- Key area to monitor: ₹760–₹795
Educational Disclaimer
This analysis is provided solely for educational and informational purposes based on the technical chart provided. It should not be construed as investment advice or a recommendation to buy, sell, or hold any security. Technical analysis does not guarantee future price movement or returns. Investors should conduct their own research and consider their risk profile before making any investment decision. Securities market investments are subject to market risks. For Research Services, Stock Market Risks, Disclosures and Disclaimers, Investor Charter, Complaint Table, Grievances, MITC, Refund Policy, and Others.
Please visit our website: www.researchanalystrohit.com and read everything to avoid any future conflict of interest.