
Technical Analysis — 29 Aug 2026

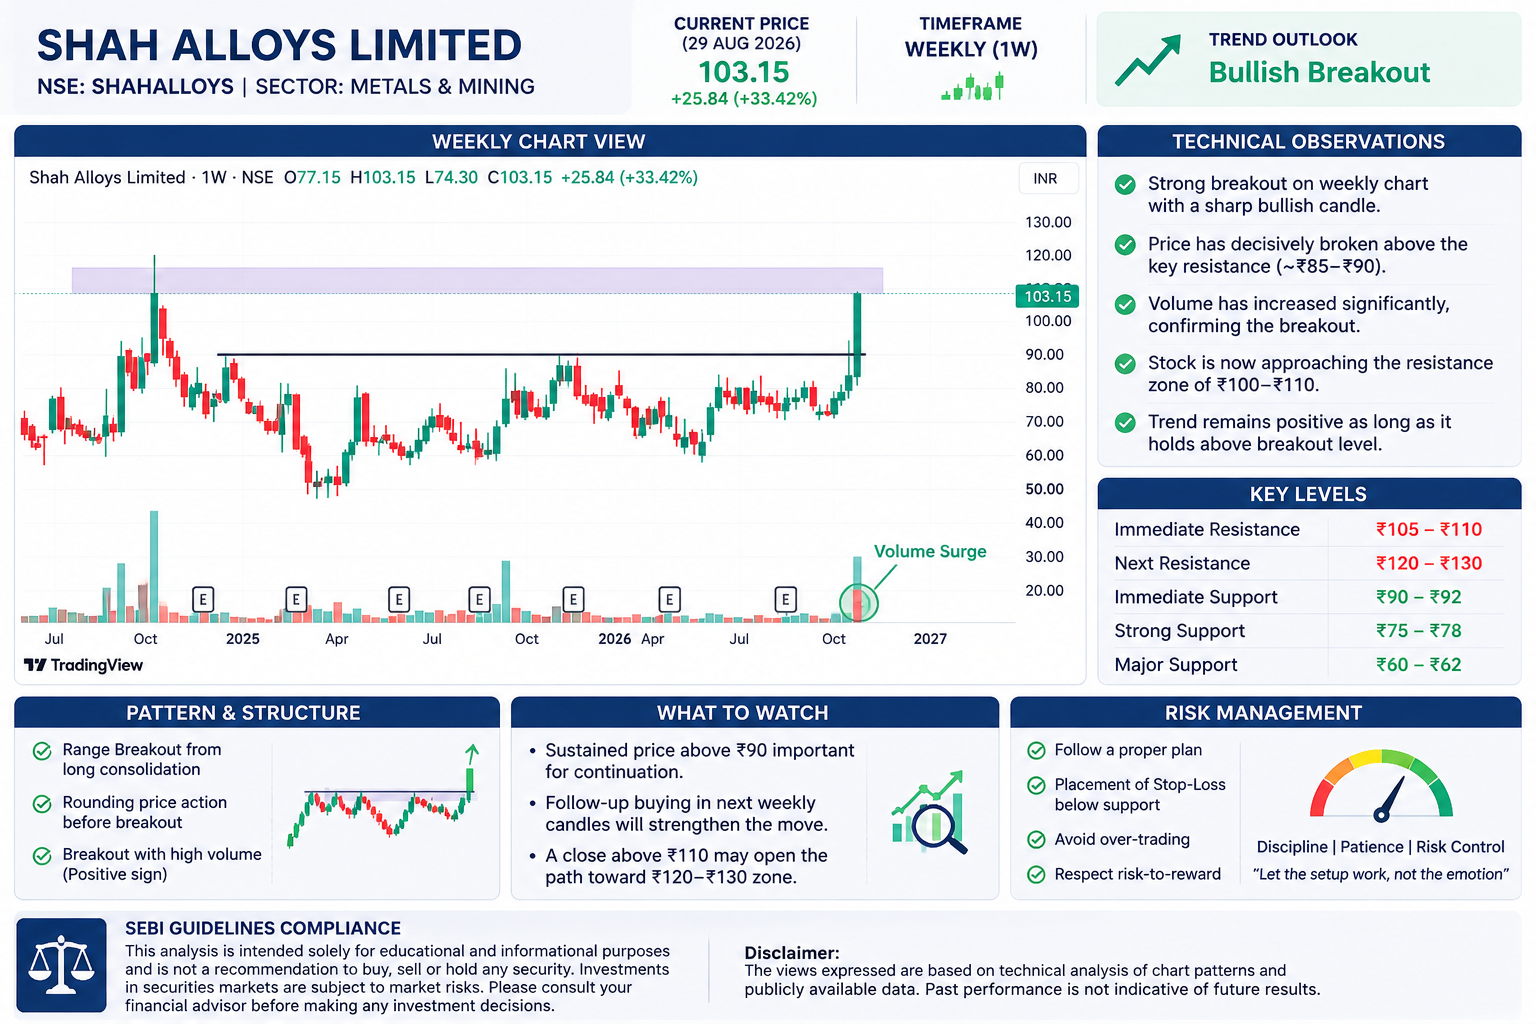
📊 Shah Alloys Ltd. – Weekly Technical Analysis
Educational & Informational Purpose Only
Shah Alloys Ltd. has shown a significant change in its weekly price structure after a prolonged consolidation phase.
🔹 Breakout: The stock has broken above the previous resistance zone around ₹83–85, accompanied by a sharp bullish weekly candle.
🔹 Volume: The breakout is supported by a noticeable increase in volume, which is an important technical observation when assessing the strength of a price move.
🔹 Current Price: ₹103.15
🔹 Resistance Zones:
• ₹105–110 — immediate resistance
• ₹120–130 — next major resistance zone
🔹 Support Zones:
• ₹90–92 — immediate support / breakout area
• ₹75–78 — secondary support
• ₹60–62 — major support
📈 Technical Structure
The weekly chart currently reflects:
✅ Breakout from a prolonged consolidation range
✅ Higher-high formation
✅ Strong price momentum
✅ Significant volume expansion
⚠️ Price is approaching an important resistance zone, so follow-through price action remains important.
Going forward, traders and investors may observe whether the stock can sustain above the breakout zone and how price and volume behave around the ₹105–110 resistance area.
Technical analysis is about probabilities and structured observation—not certainty. Proper risk management and disciplined decision-making remain important.
Rohit Sharma
SEBI Registered Research Analyst
Registration No.: INH000022109