
Technical Analysis — 11 Jun 2026

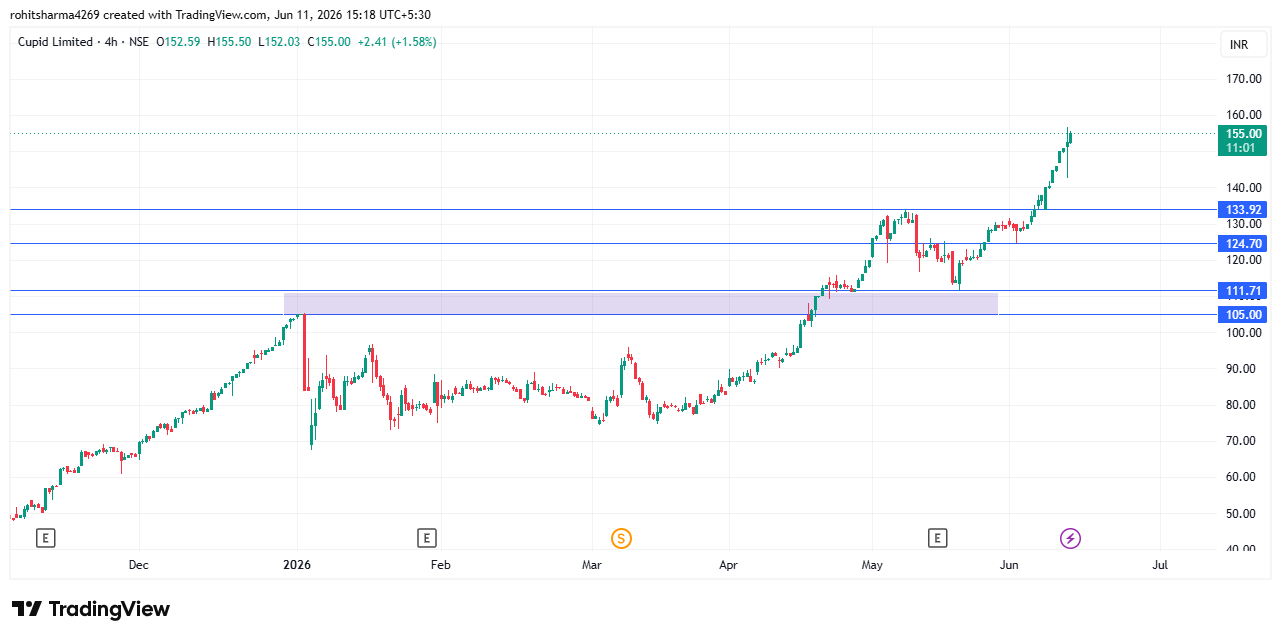
Trend Analysis
- The stock is in a strong bullish trend.
- Since March-April, the chart has been forming Higher Highs and Higher Lows, confirming an uptrend.
- Price has recently given a breakout above the ₹133.92 resistance, which is a significant bullish signal.
- Current price: ₹155 (approximately), indicating strong momentum buying.
Bearish Scenario
Signs of weakness would appear if:
- Price falls below ₹133.92 and closes there.
- Momentum candles start showing long upper wicks near ₹160.
- Breakdown below ₹124.70 could trigger deeper correction toward ₹112.
This analysis is purely for educational and informational purposes. It does not constitute investment advice, a recommendation, or a solicitation to buy or sell any financial instrument. Investors should conduct their own research and consult a qualified financial advisor before making investment decisions.
For Research Services, Stock Market Risks, Disclosures and Disclaimers, Investor Charter, Complaint Table, Grievances, MITC, Refund Policy, and Others.
Please visit our website: www.researchanalystrohit.com and read everything to avoid any future conflict of interest.