
Gold Under Pressure: Technical Breakdown Signals Further Weakness

What the Chart Reveals
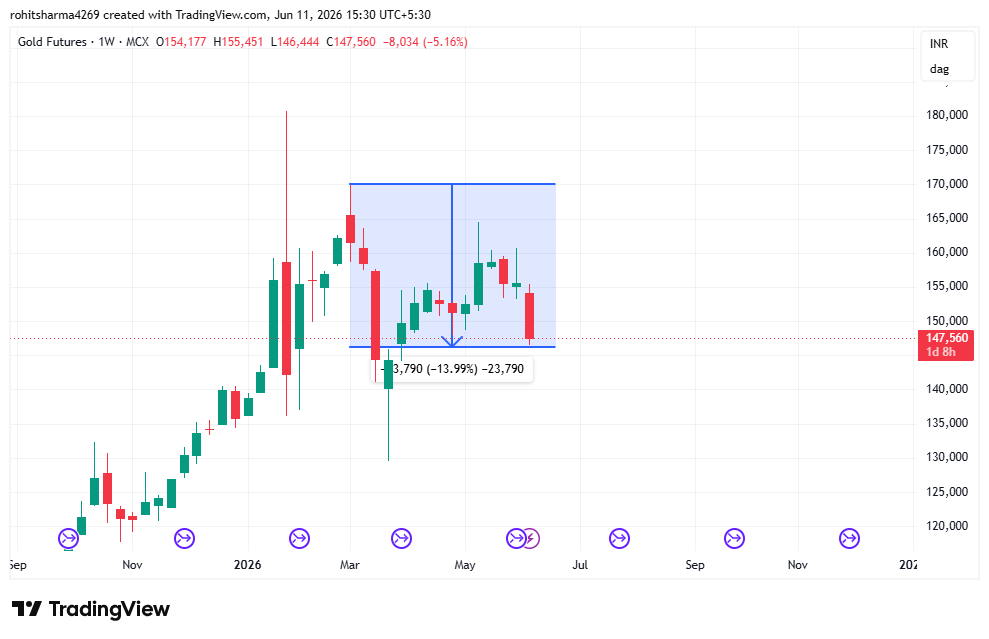
After a strong rally from ₹120,000 levels to a high near ₹170,000, Gold entered a consolidation phase. The highlighted rectangle on the chart represents a trading range between:
🔹 Resistance: ₹170,000
🔹 Support: ₹147,500
For several weeks, Gold traded within this range, but the latest weekly candle has pushed prices back to the lower boundary of the consolidation zone.
This post is shared for educational awareness and market learning purposes only. The analysis presented is based on publicly available data and technical chart patterns and should not be construed as a buy, sell, or hold recommendation.
For Research Services, Stock Market Risks, Disclosures and Disclaimers, Investor Charter, Complaint Table, Grievances, MITC, Refund Policy, and Others.
Please visit our website: www.researchanalystrohit.com and read everything to avoid any future conflict of interest.