
Technical Analysis — 12 Jun 2026

For educational And Technical Analysis purposes only, No Recommendation.
What the chart shows
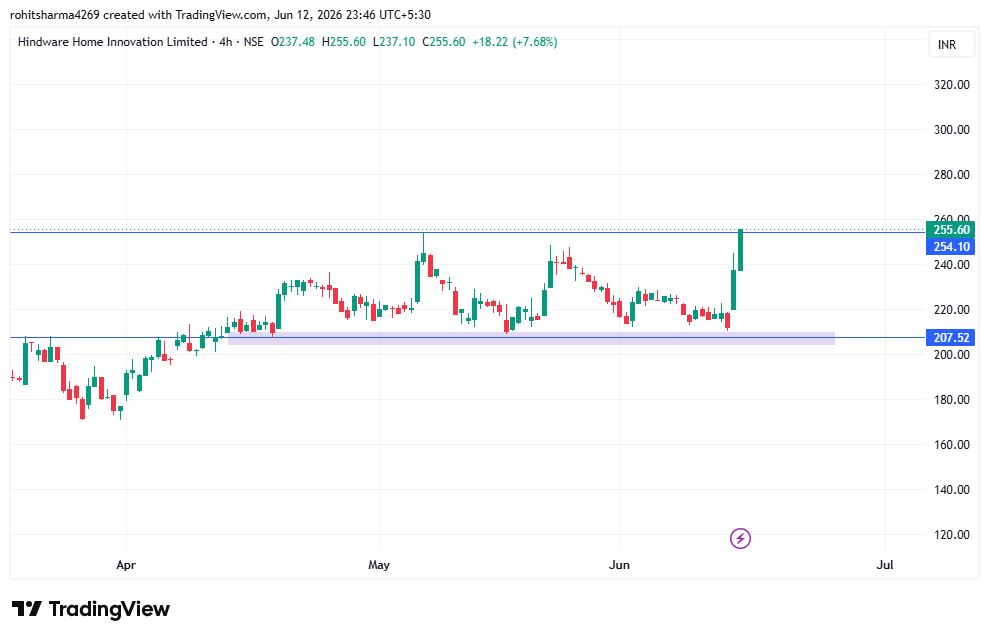
1. Strong support zone around ₹207–210
The shaded area and horizontal line indicate a demand/support zone.
Price has tested this region multiple times since April and buyers consistently stepped in.
Repeated successful tests strengthen the significance of the support.
2. Resistance around ₹252–254
The upper blue line marks a key resistance level.
Price was rejected from this area several times in May and June.
The latest candle has reached this resistance again with strong momentum.
3. Breakout attempt underway
The recent large green candle:
Started near ₹220.
Closed around ₹252.
Shows strong buying interest and expansion in volatility.
Indicates institutions or larger participants may be accumulating.
However, a breakout is not confirmed until price sustains above resistance.