
Technical Analysis — 18 Jun 2026

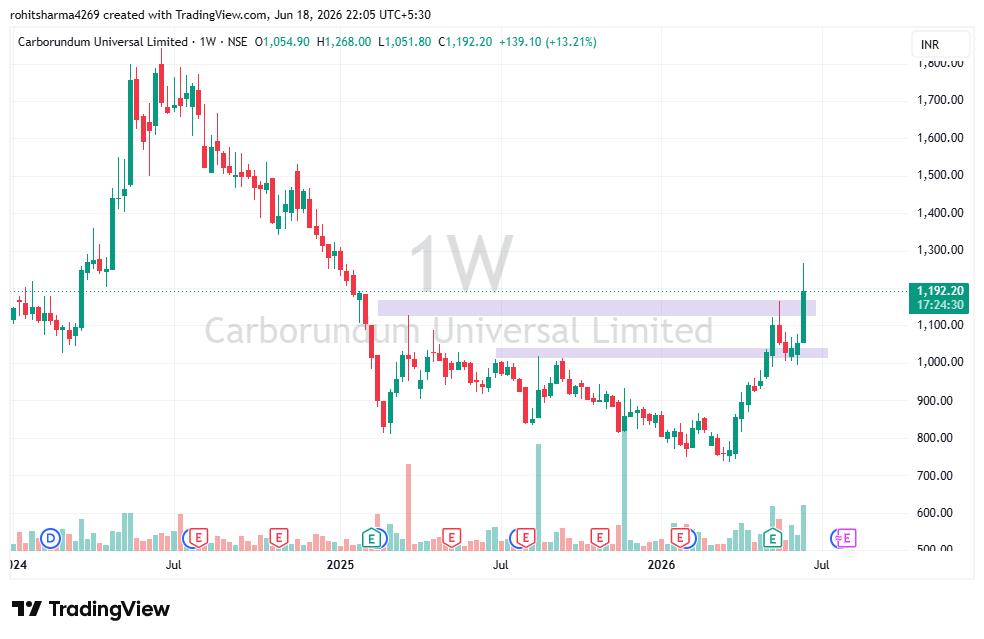
Carborundum Universal Ltd. (CARBORUNIV) – Weekly Chart Analysis (Educational Purpose Only)
Price Structure
On the weekly timeframe, the stock appears to have transitioned from a prolonged corrective phase into a recovery phase. After making lower highs and lower lows throughout much of 2024–2025, price action has recently started forming higher highs and higher lows, indicating improving market structure.
Demand and Supply Zones
The chart highlights two important zones:
- Demand Zone: Approximately ₹1,000–₹1,030
- Price has reacted positively from this area multiple times.
- Buyers have shown willingness to absorb supply around these levels.
- Supply/Resistance Zone: Approximately ₹1,120–₹1,160
- Historically acted as resistance.
- Recent price action shows a strong move through this zone, suggesting increased buying participation.
Breakout Observation
The latest weekly candle has moved above a previously identified supply zone. From a technical perspective, this indicates that market participants were willing to transact at higher prices than before.
However, in technical analysis, a breakout is generally considered more reliable when:
- Price sustains above the zone for multiple periods.
- Follow-through buying emerges in subsequent candles.
- Volume remains supportive.
Volume Analysis
A noticeable increase in trading volume accompanies the recent upward move.
Higher-than-average volume during an advance often suggests:
- Increased market participation.
- Greater interest from institutional and retail participants.
- Stronger conviction behind the move compared to low-volume rallies.
Volume alone should not be viewed as confirmation of future direction but can provide context to price action.
Trend Analysis
The stock currently exhibits:
- Higher lows from the recent bottoming area.
- Strong upward momentum over the last several weeks.
- Recovery from the broader downtrend that started after the 2024 highs.
The next phase of trend development will depend on whether the stock can maintain its position above recently crossed resistance areas.
Candlestick Perspective
The latest weekly candle is large and bullish in nature, reflecting strong upward momentum during the week.
Such candles often indicate:
- Strong buyer participation.
- Shift in short-term sentiment.
- Expansion in price range.
Nevertheless, a single candle should always be interpreted within the context of the broader trend and surrounding price structure.
Educational Disclaimer
This content is for educational and informational purposes only and should not be construed as investment advice or a recommendation to buy, sell, or hold any security. Investments in securities markets are subject to market risks. Please do your own research and consult your financial advisor before making investment decisions.