
Technical Analysis — 27 Jun 2026

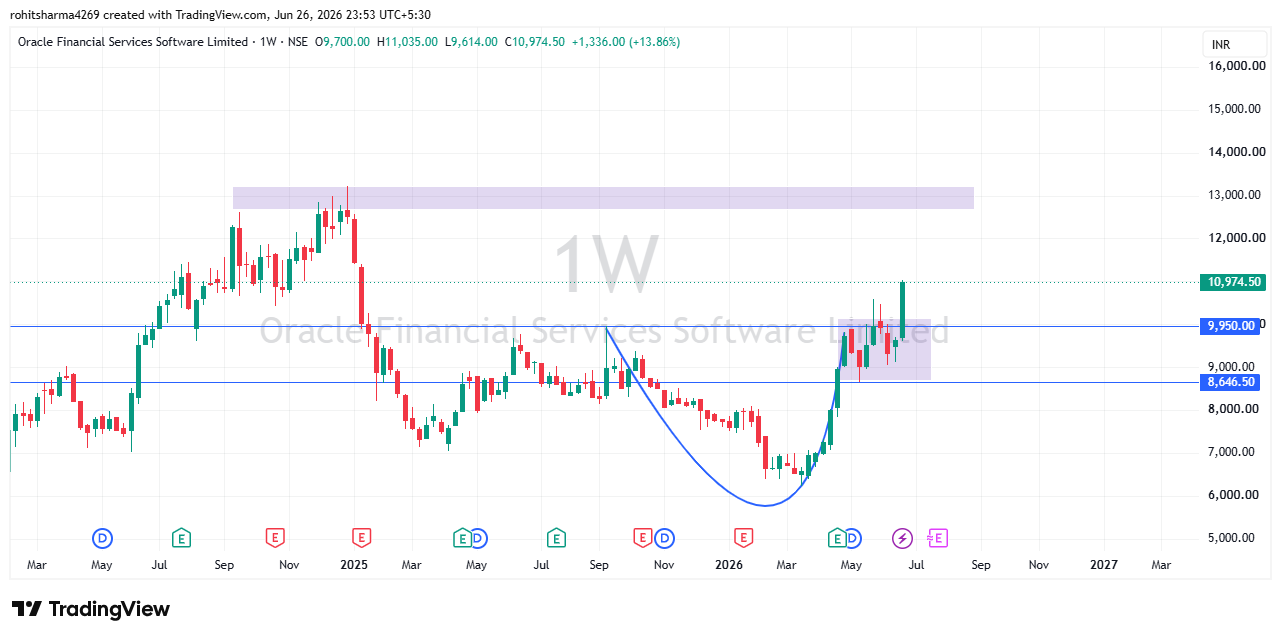
Oracle Financial Services Software Ltd. (OFSS)
Timeframe: Weekly (1W)
Analysis Type: Educational Technical Analysis (No Buy/Sell Recommendation)
Technical Overview
Based on the weekly chart provided, OFSS has shown a notable improvement in price structure after a prolonged corrective phase.
1. Trend Analysis
- The stock remained in a corrective/downtrend for several months after failing near the ₹12,800–13,100 resistance zone.
- Recently, the price has formed a rounded bottom (Cup-like recovery), indicating a gradual shift in market sentiment from bearish to bullish.
- The stock is now making higher highs and higher lows, suggesting strengthening momentum on the weekly timeframe.
2. Breakout Observation
- Price has closed decisively above the ₹9,950 resistance level, which had previously acted as a supply zone.
- A weekly close above this level indicates that buyers have shown strength in overcoming prior resistance.
- Sustaining above this zone over subsequent sessions would be an important technical observation.
3. Support Levels
Immediate Support: ₹9,950
- This previous resistance may now act as a support if the stock consolidates.
Major Support: ₹8,646
- This level has acted as a significant demand area in the past.
- A move below this level would weaken the current technical structure.
4. Resistance Levels
Immediate Resistance: ₹11,000–11,200
- The stock is currently approaching this zone where some profit booking may emerge.
Major Resistance: ₹12,800–13,100
- This remains the strongest historical supply zone visible on the chart.
- The stock faced rejection from this region during the previous uptrend.
5. Chart Pattern
The weekly chart resembles a Rounded Bottom (Cup-like Formation).
Characteristics observed:
- Extended correction followed by gradual accumulation.
- Smooth recovery in price.
- Breakout above intermediate resistance.
- Improving market structure.
A continuation of higher highs and higher lows would further strengthen this pattern.
6. Price Structure
Current structure indicates:
- ✅ Higher Highs
- ✅ Higher Lows
- ✅ Bullish Breakout above resistance
- ✅ Positive shift in market structure
7. Risk Management Perspective
From a technical analysis standpoint:
- Traders often monitor whether the breakout level holds as support.
- Chasing sharp rallies without a predefined risk management plan may increase trading risk.
- Position sizing and disciplined risk management remain essential regardless of the chart setup.
- Educational Disclaimer
- This analysis is provided solely for educational and informational purposes to explain technical chart structures and should not be construed as investment advice or a recommendation to buy, sell, or hold any security. Technical analysis is based on historical price and volume data and does not guarantee future performance. Investors should conduct their own research and consider their financial objectives, risk tolerance, and consult a qualified financial advisor before making any investment decisions. Investments in securities markets are subject to market risks.