
Technical Analysis — 1 Aug 2026

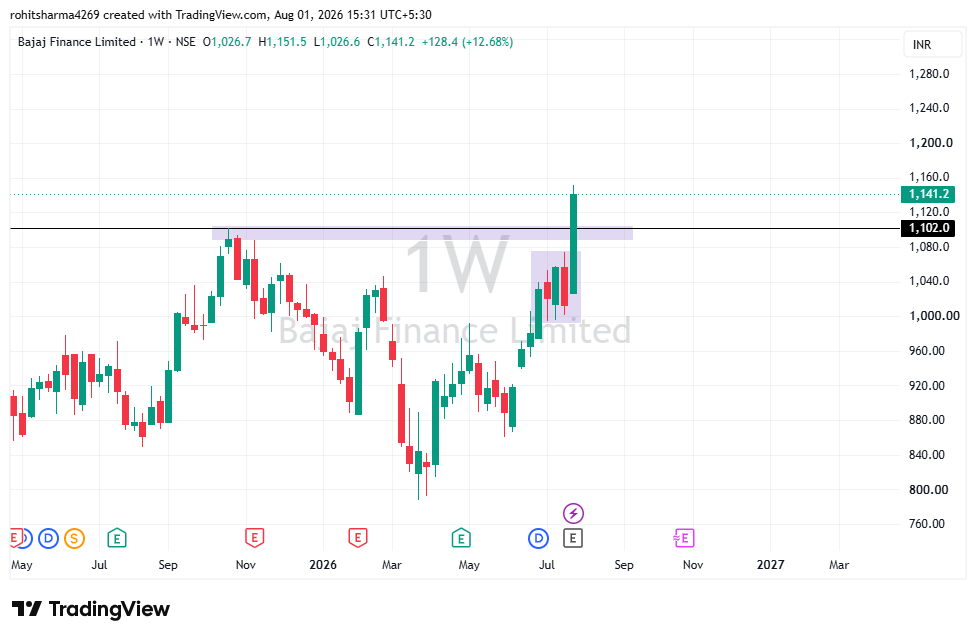
Educational Technical Analysis – Bajaj Finance Ltd. (Weekly Chart)
Disclaimer: This analysis is provided strictly for educational purposes to explain technical analysis concepts. It is not investment advice, research advice, a buy/sell recommendation, or a trading call. Market participants should conduct their own research and consult a SEBI-registered investment professional before making any investment or trading decisions.
Chart Overview
- Timeframe: Weekly (1W)
- Current Price (approx.): ₹1,141
- The stock has recently shown strong bullish momentum after recovering from lower levels.
- Price has moved above a previously marked resistance/supply zone around ₹1,090–₹1,105, indicating buying strength.
Price Structure
- The stock has been forming higher highs and higher lows over recent weeks.
- This suggests that buyers are currently dominating the medium-term trend.
- The latest weekly candle is a strong bullish candle with a noticeable expansion in price range, reflecting increased participation.
Breakout Observation
- The highlighted resistance zone around ₹1,090–₹1,105 acted as an important supply area.
- The latest weekly candle has closed above this zone, which may indicate a potential breakout.
- From a technical perspective, a breakout is generally considered stronger if it is supported by:
- Sustained weekly closes above the resistance level.
- Healthy trading volume (volume confirmation cannot be verified from this chart since volume is not visible).
Support Levels
If the breakout sustains, the following areas may act as support:
- Immediate Support: ₹1,100–₹1,110
- Secondary Support: ₹1,040–₹1,060
- Major Support: ₹980–₹1,000
These are zones where buyers may show interest if the stock experiences a pullback.
Resistance Levels
Potential resistance areas visible on the chart include:
- Immediate Resistance: ₹1,155–₹1,170
- Next Resistance: ₹1,200
- Psychological Resistance: Around ₹1,250
These levels are approximate chart-based observations rather than exact price targets.
Trend Assessment
- Short-term Trend: Bullish
- Medium-term Trend: Bullish
- Long-term Structure: Improving, provided the price remains above the breakout zone.
Possible Technical Scenarios
Scenario 1: Bullish Continuation
- If the stock continues to hold above the previous resistance zone (₹1,090–₹1,105), it may indicate that buyers continue to maintain control.
- Continued strength could lead to an attempt to test higher resistance areas.
Scenario 2: Pullback After Breakout
- After a strong rally, the stock may revisit the breakout zone.
- If buyers defend this area and the stock resumes upward movement, it would be considered a constructive technical development.
- If the price falls back below the breakout zone and sustains there, it could indicate that the breakout has weakened.
Candlestick Observation
- The latest weekly candle is a large bullish candle, reflecting strong buying momentum.
- Such candles often indicate strong sentiment; however, it is generally useful to observe follow-through in subsequent candles before drawing conclusions about trend continuation.
Risk Management (Educational Concept)
Regardless of the chart pattern:
- Avoid making decisions based on a single candle.
- Wait for confirmation through subsequent price action.
- Consider multiple factors such as trend, support/resistance, volume, and overall market conditions.
- Apply appropriate risk management and position sizing.
Educational Summary
From the weekly chart alone:
- Overall trend appears bullish.
- Price has moved above an important resistance zone, suggesting potential strength.
- The breakout would be considered more reliable if future weekly candles continue to hold above the breakout area.
- Key observation levels:
- Support: ₹1,100–₹1,110 and ₹1,040–₹1,060
- Resistance: ₹1,155–₹1,170 and ₹1,200
SEBI Educational Disclaimer: This chart interpretation is intended solely to explain technical analysis concepts. It should not be construed as research, investment advice, or a recommendation to buy, sell, or hold any security. Past price behaviour does not guarantee future performance.